The Spry Group believes in the power of data visualization.
Of course, our solutions are built from tools developed long before us. The Sankey Diagram, for example, helps visualize the amount of flow through a system. First used in the mid-1800’s, the Sankey diagram has gone on to help companies understand the flow of energy or costs from one step to another.
Today we’re going to spotlight the Sankey Diagram and show why it’s more useful than ever today.
Understanding the Sankey Diagram
We’ve all seen flowcharts. Arrows and boxes serve to show a how a process moves from one step to another. Sankey Diagrams are a type of flowchart, where the arrows’ width is proportionate to the quantity passing through.
Let’s take an example of a proposed UK energy production and consumption scenario in 2050. To understand how it works, take a look at the left and right axes. They are energy sources and demand sectors, respectively. The width of the arrows corresponds to the proportion of energy coming from that energy source.
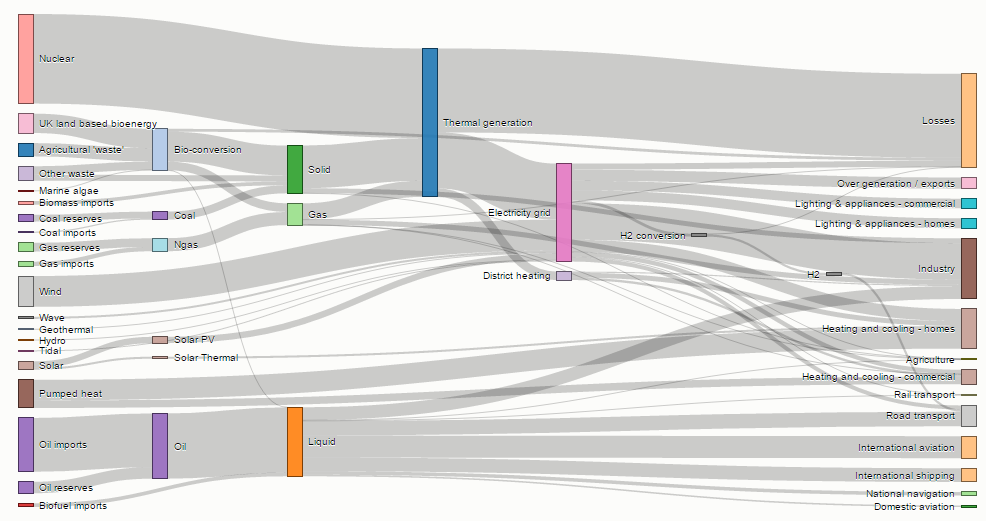
We can see in this example that nuclear and oil imports are the largest energy sources in 2050. We can also see certain sources, such as bio-conversion and thermal, hovering in the middle of the Sankey diagram. These nodes represent energy sources that are created from others earlier in the network. Bio-conversion, for example, is created from bioenergy, agricultural waste, and other waste.
Sankey Diagrams are closely related to alluvial diagrams and are used to show changes in a network over time, such as with the development of the field of Neuroscience. While Sankey Diagrams give a snapshot of network flow at a particular point in time, alluvial diagrams show network change over time.

Along the vertical axis are the names of nodes involved at the start and end of the timeframe, while the horizontal axis lays out the timeframe in intervals. In the Neuroscience example, the nodes are fields of medicine, and the intervals are every year from 2001-2007.
A brief history of the Sankey Diagram
The Sankey Diagram has been around for quite some time. In the mid-nineteenth century, French civil engineer Charles Minard created a flowchart to illustrate the troop losses Napoleon suffered during the infamous Russian campaign of 1812.
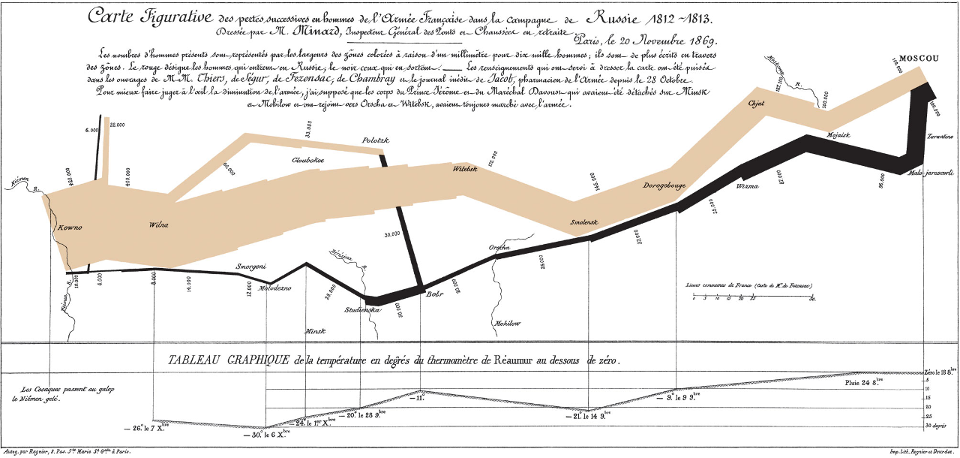
http://www.economist.com/blogs/dailychart/2011/07/data-visualisation
This chart is important for two reasons:
-
Minard included six types of data, including number of troops, location, and temperature, in a two-dimensional space.
-
The width of the arrow (one millimeter per ten thousand men) clearly showed the losses Napoleon suffered as he made the way to Russia.
Though Minard laid out a great deal of information in his chart, the term Sankey Diagram wouldn’t come until the turn of the twentieth century.
Irish engineer Matthew Henry Phineas Riall Sankey developed the chart for showing the energy efficiency of the steam engine. He presented the chart in an 1898 article for the Minutes of Proceedings of The Institution of Civil Engineers. His peers recognized the value in the then-called Sankey Diagram. The rest, as we say, is history.
Sankey Diagram in practice
The Sankey Diagram is a data visualization tool used by companies large and small to understand network flow. Some examples include:
Google Analytics’ Behavior Flow Report
The Behavior Flow Report helps users understand how visitors are engaging with your website. For example, what content is driving clicks to your site? From those users, how many are signing up for your newsletter?
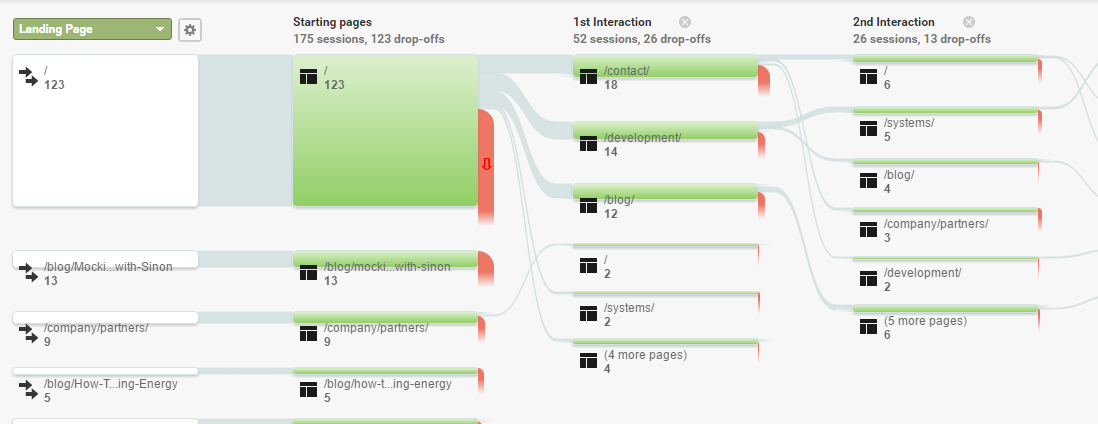
Google Analytics organizes the report into nodes, connections, and exits. Nodes are the points where traffic moves through, such as landing pages or blog posts. Connections show the paths from one connection to another. Exits show where traffic left the flow. In good Sankey Diagram fashion, the thickness of these arrows relates to the amount of traffic moving through.
For content marketers and advertisers, this report is perfect for understanding and modifying their strategies to drive more website traffic.
Government Reports
Government energy agencies use Sankey Diagrams to show energy use and consumption. The United States Energy Information Agency (EIA) includes Sankey Diagrams in it’s Annual Energy Outlook Report. For 2015, Sankey diagrams were used to illustrate energy flow, electricity flow, and others.
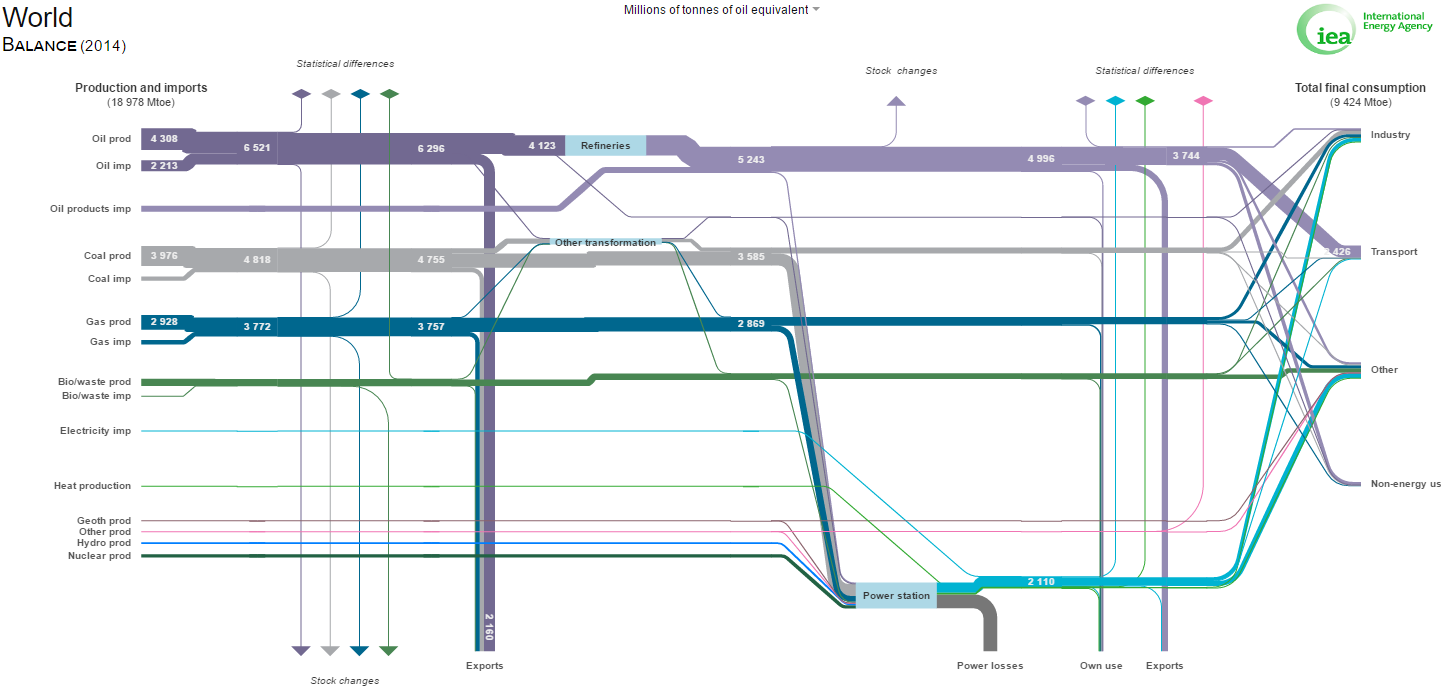
The International Energy Agency (IEA) has an interactive Sankey Diagram on their site to show energy production and imports for the world and individual countries.
Making the Sankey Diagram work for you
While the Sankey Diagram is mostly associated with energy consumption, businesses of all kinds can make this visualization tool work for them.
Business Surveys
From startups trying to understand their target market to established businesses preparing for an upcoming conference, surveys are a great way to gain information about an audience. Visualizing survey data by factors like location, industry, and demographics can reveal patterns that would be harder to spot with statistical analysis.
Let’s take a small printing business as an example, where the owner wants to provide better services to his customers. The business recently surveyed their customers and created a Sankey Diagram to see which customers choose which services. The Sankey Diagram might show that specialty printing is associated with mid-sized local businesses. Periscopic took this one step further to add color and several factors into their Sankey Diagrams to better understand this year’s attendees to their conference.
Flow of Funds for Nonprofits
Nonprofits rely on grants, donations, PRIs, and other sources of funding. Understanding this flow and how it relates to specific programs can help a nonprofit better understand and plan for future years.
For example, if a Sankey Diagram shows that most funding comes from grants, the nonprofit knows it can either hedge against that source by looking for new funding sources. Conversely, the nonprofit could double-down and funnel resources into increasing grant proposals. While next steps depend on the nonprofit’s situation, the Sankey Diagram provided the visualization needed to understand what these next steps were.
What Sankey can do for your business
We could go on with examples showing the power of Sankey Diagrams. However, we recommend you try your hand at creating one that suits your business needs.
Today there a variety of free online tools available to generate Sankey Diagrams, such as Sankey Diagram Generator, Google Charts, and wikiBudgets. The power of data visualization should never be underestimated. Every business needs data, but also the tools to turn that data into meaningful information to draw conclusions. Sankey Diagrams make that process a bit easier.