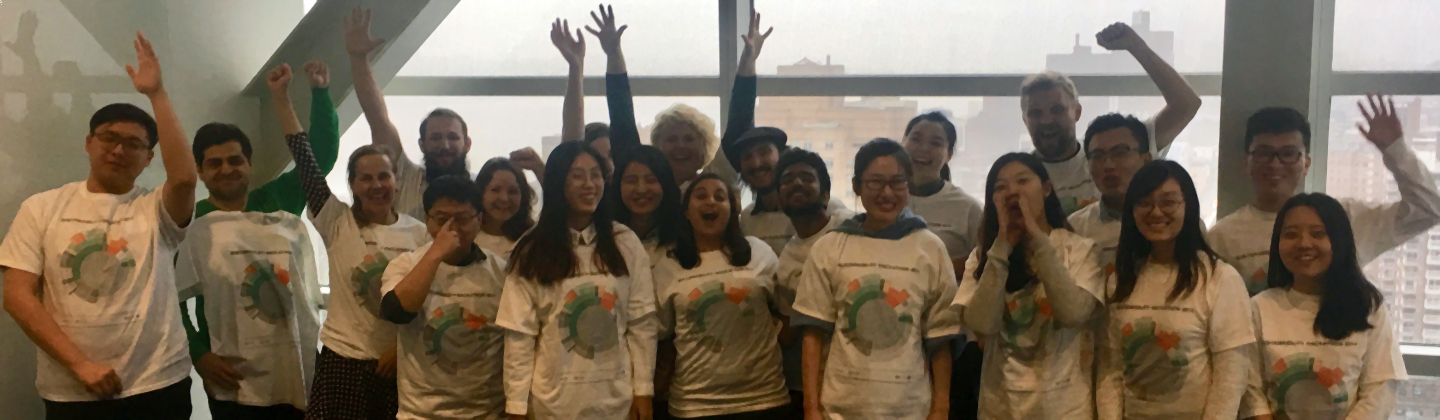
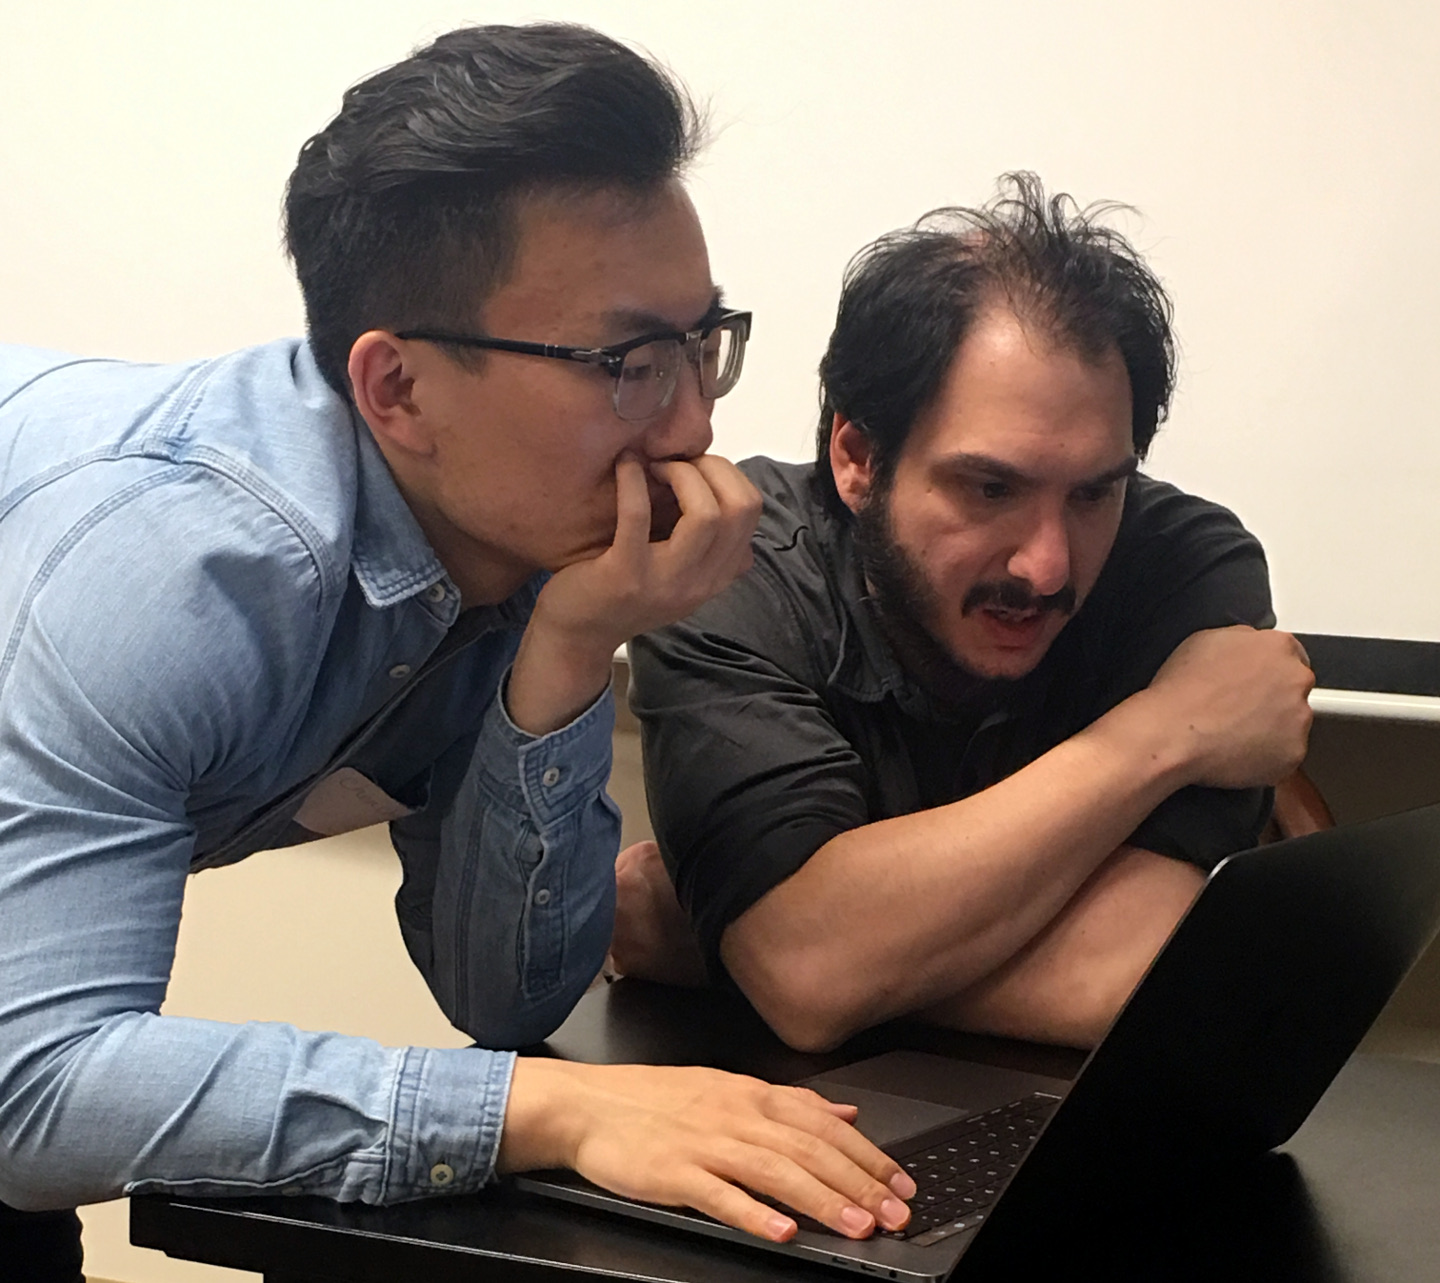
Friday May 31, 2017 developers enjoyed an entire day of learning and coding at Sustainability Hackathon, hosted by CoClear in partnership with Columbia University’s Data Science Institute (DSI) and CDP (formerly the Carbon Disclosure Project). The 18 students learned about D3, and created successful visualizations of product data with the overarching goal of encouraging more sustainable energy practices and reduction of carbon emissions on a per product basis.
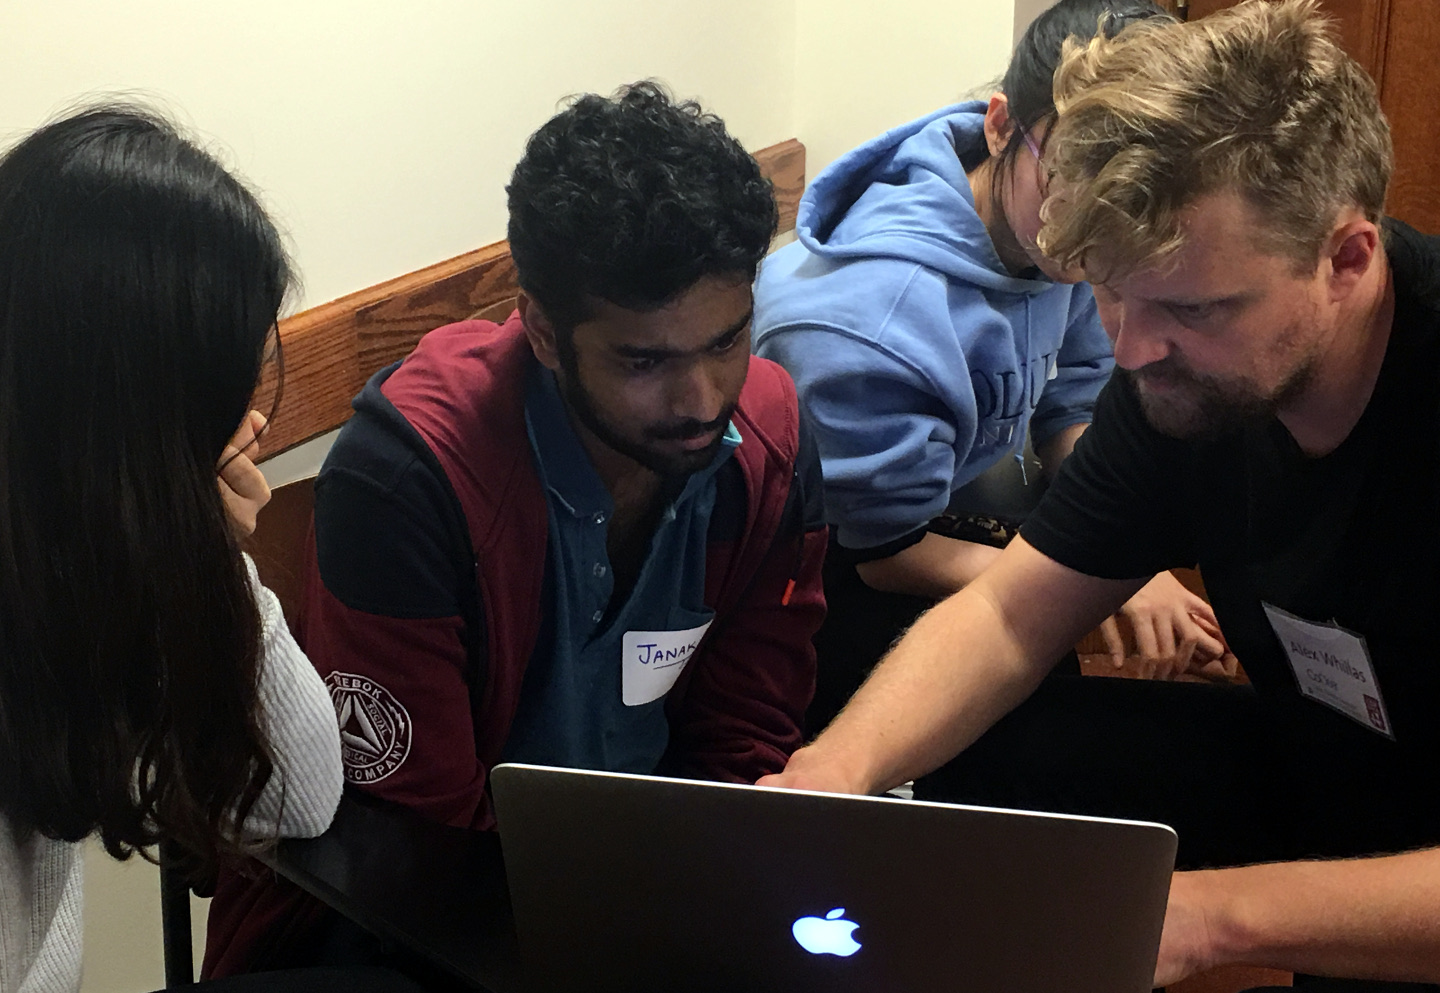
CoClear is a NYC based sustainability data startup who ran the Hackathon where the group explored the visualization of product life cycle analysis (LCA) data that was publicly disclosed to CDP. In addition to the CoClear team, a D3.js technical instructor and Spry Group software developers Darrel O’Pry and Paolo Unger-Dvorchik who worked with the students. Later in the day, the group was joined by colleagues from CDP and DSI, who attended the event to serve on the judging panel.
“Climate change, water scarcity and deforestation are unparalleled global challenges that require a systemic change in market behavior. To achieve this, CDP runs the global disclosure system that enables companies, cities, states and regions to measure and manage their environmental impacts.”
CDP has been building the most comprehensive collection of self-reported environmental data in the world, used by a global network of investors, purchasers, and political policymakers to influence better-informed decisions to create positive change. This Hackathon gave the DSI students an amazing opportunity to contribute to CDP’s efforts by creating data visualization tools to inform global sustainability efforts.
From 8:30 a.m. till 7 p.m., the group focused on making interactive data visualizations from the data. While the primary goal was to teach the students how to create a data visualization, a driving secondary goal was to help sustainability-minded companies see how their products measure up to competing company products by using the interactive tool.
During this Hackathon, students were provided with training and supervision so that they gained knowledge both of product life cycle analysis and the power of data visualization tools. For those already familiar with D3.js a refresher was provided at the start of the event. Participants learned the processes within D3.js required to build data driven, dynamic web content that follows the core goals of data visualization. The primary objectives being:
- making large data sets coherent
- revealing the data at several levels of detail
- avoiding data distortion
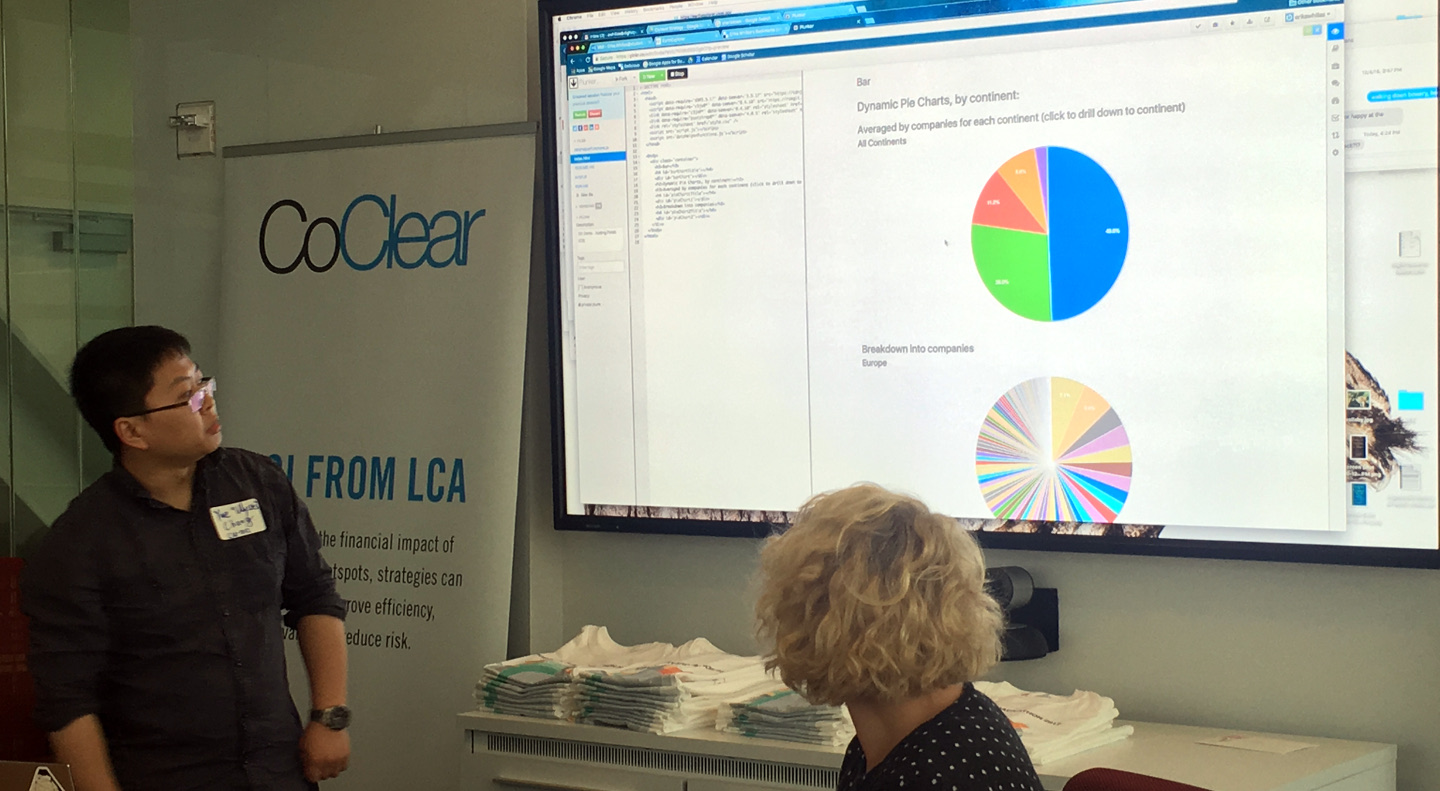
The data was already cleaned by CoClear, ready to use, and focused on the life cycle assessments of 546 product LCAs from 108 companies across 26 countries. The day-long Hackathon’s agenda included:
1) Selecting data, pulling it in from outside sources, importing and transforming it. 2) Refining the grouping and scale to manipulate the data set within different kinds of charts found in C3 reusable libraries. 3) Adding interactivity to charts with features like mouse actions, subcharts, fully customizable colors, labels, tooltips, and legends for polish.
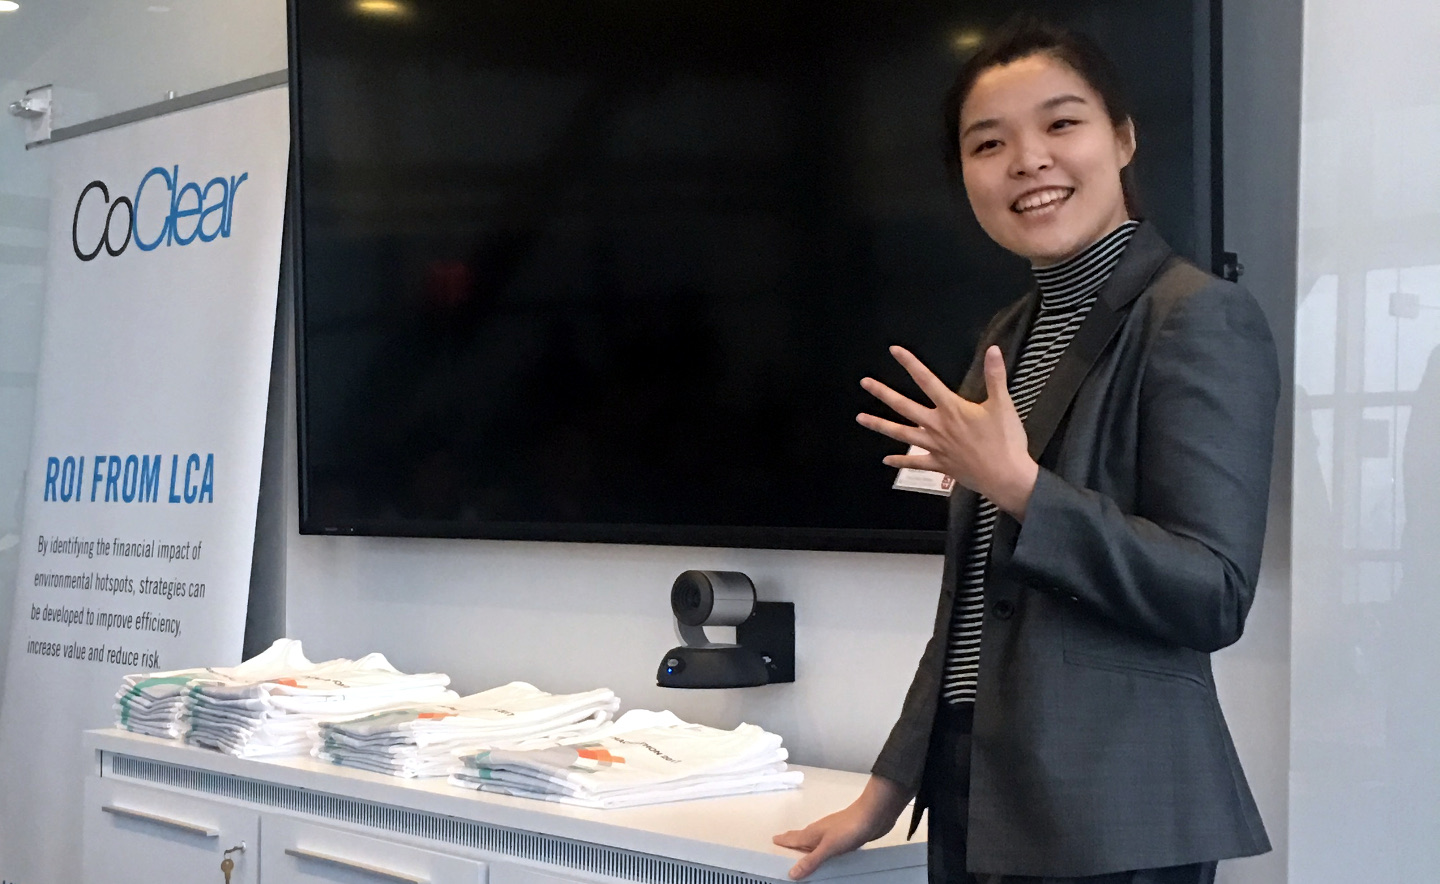
“We wanted to work with the students to explore the most effective data visualizations possible for this set of data. Ones that will enable participating companies to interact with the data and compare it across products, industries, and competitors…. CoClear believes that when companies can interact with their own publicly disclosed LCAs and see and compare them to other brands in their sector, the sense of competition will increase.” - said Sally Paridis, founder of CoClear.
D3 wasn’t just about shiny charts at this Hackathon, it was about driving DOM manipulation through data with an energy sustainability agenda in mind. CoClear believes that through successful data visualizations of product data the path to achieve higher value chain efficiency through product lifecycle analytics will become more obvious to participating companies
“The students worked intensely through the afternoon, finally breaking to head over to the beautiful penthouse conference room of the DSI building to present their findings. Each student group took a different approach to the question of how to most effectively show data. The range within the data stretched from a list of regions, countries, corporation names, product identities to and continued becoming more and more detailed to the granular levels of showing upstream, downstream, operational emissions as well as carbon intensity at the other end of the pendulum,” noted Paridis.
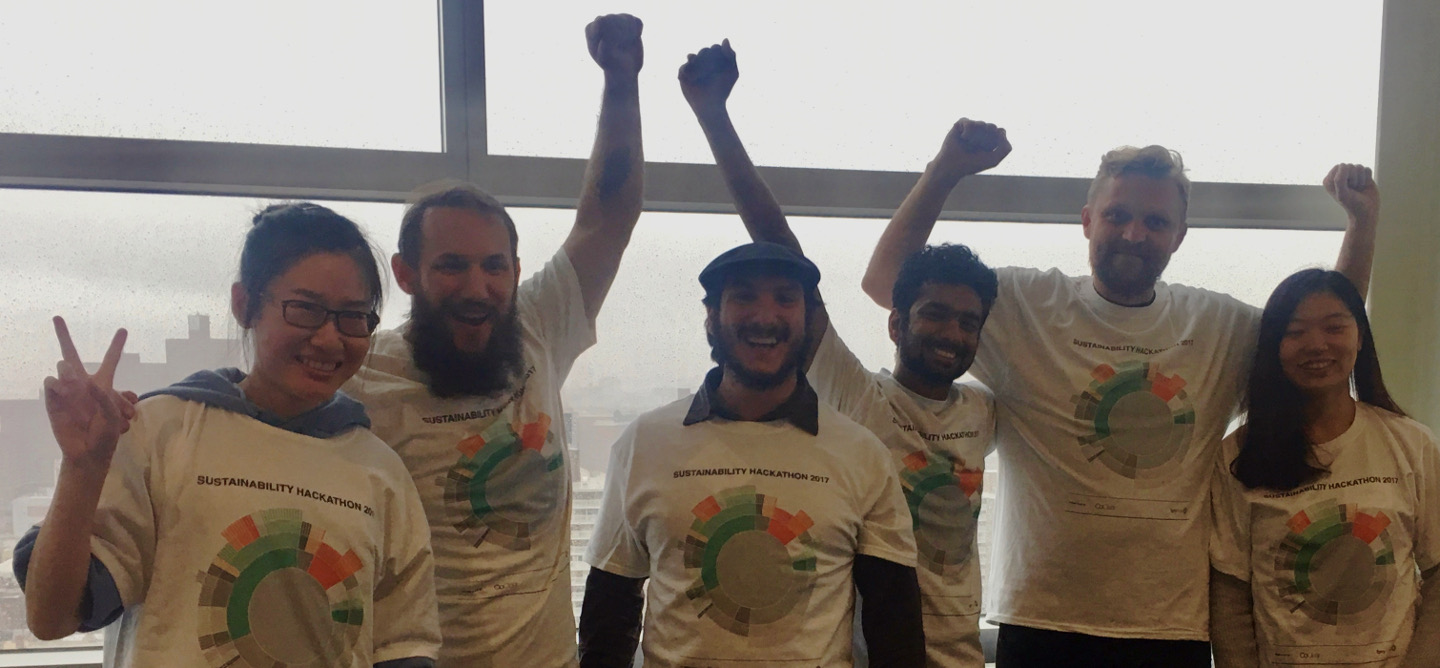
At the end of the day, representatives from CDP arrived to participate on the judging panel. Judges Yue Quie and Andrea Tenorio from CDP and Ali Mehani from DSI found that Team Dragon lead by Janak A. Jain won the day with a detailed and multi-level visualization of the CDP data. Spry Group would like to thank all the students that participated in this year’s Sustainability Hackathon, and congrats to winning Team Dragon!
![]()
![]()